Log Your Image Pipelines
Log your images and visualize your image pipelines with Graphbook!
Warning
This feature is currently in beta. Please report any issues to the repo.
Graphbook allows you to log images and monitor your image pipeline outputs. Compatible with the torchvision.transforms library, Graphbook will log each transform output. This is useful for debugging and visualizing your data augmentations during vision-based training with PyTorch.
Important: This feature should not be confused with the logging feature that exists for Graphbook Pipelines.
See graphbook.steps.Step.log() if you want to log textual information associated with specific nodes in your Graphbook Pipelines.
Torchvision Transforms
To log torchvision transforms, you can use graphbook.logger.TransformsLogger.
By passing your transforms.Compose object into the logger, you can log the images at each step of the transform and view them in Graphbook.
from graphbook.logger import TransformsLogger
import torchvision.transforms as transforms
from PIL import Image

# Define your transforms
transform = transforms.Compose([
    transforms.Resize(256),
    transforms.Grayscale(),
    transforms.RandomRotation(45),
    transforms.ToTensor(),
])

# Log your transforms
logger = TransformsLogger(name="my_transforms")
transform = logger.log(transform)

# Process an image
img = Image.open("path/to/image.jpg")
img = transform(img)
The above should create a file logs/my_transforms.log from your current working directory.
To view your image logs, start graphbook (simply by running graphbook in your terminal) and navigate to http://localhost:8005 in your browser.
This will open the Graphbook UI in your browser, where you can view your image logs.
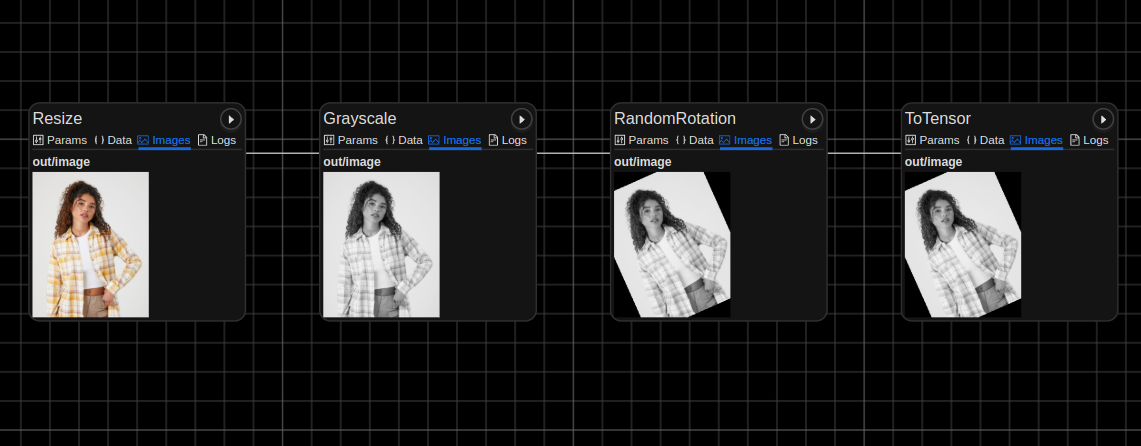
You should see my_transforms.log underneath Executions on the bottom left. Click on it to view the images:
Writing logs is multiprocess-safe, so you can use torch.utils.data.DataLoader with multiple workers. Example:
from graphbook.logger import TransformsLogger
import torchvision.transforms as transforms
from torch.utils.data import DataLoader
from PIL import Image

# Define your transforms
transform = transforms.Compose([
    transforms.Resize(256),
    transforms.Grayscale(),
    transforms.RandomRotation(45),
    transforms.ToTensor(),
])

# Save disk space by logging every 10th image for each transform
logger = TransformsLogger(name="my_dataset_transforms", log_every=10)
transform = logger.log(transform)

# Process an image
dataset = YourCustomDataset(transform=transform)
dataloader = DataLoader(dataset, batch_size=4, shuffle=True, num_workers=4)

for batch in dataloader:
    # Your training step here ...
Tip
We are currently working on adding support for other libraries, so stay tuned!
Low-Level API
If you want to have full control of the logging capabilities that Graphbook provides, you can use the graphbook.logger.DAGLogger class.
Setting up the graph and logging the images requires manual setup of the nodes and references, but allows for more flexibility.
Below is an example of usage:
import graphbook as gb
from PIL import Image
from torchvision import transforms as T

l = gb.DAGLogger("example")

def load_image(img_path):
    img = Image.open(img_path)
    return T.ToTensor()(img)

def crop(img, crop_size):
    return T.CenterCrop(crop_size)(img)

def gray_scale(img):
    return T.Grayscale()(img)

def flip(img):
    return T.RandomHorizontalFlip(p=1)(img)

img_path = "/path/to/image.png"
img = load_image(img_path)
ref = l.node("load_image", "loads an image")
ref.log(img)

img = crop(img, 600)
ref = l.node("crop", "crops the image", ref)
ref.log(img)

gray_scale_ref = l.node("gray_scale", "converts the image to grayscale", ref)
gray_scale_ref.log(gray_scale(img))

flip_ref = l.node("flip", "horizontally flips the image", ref)
flip_ref.log(flip(img))