Concepts
Workflows
A Graphbook workflow is a directed acyclic graph (DAG) that acts as a data processing pipeline well-suited for ML inference. The nodes are the building blocks of the workflow and can be one of two types: step and resource. The edges are the connections between the nodes and represent the flow of notes between them where each step processes the note in a way that is defined by custom Python code. The workflow can be visualized and monitored by anyone with access to the Graphbook web UI.
Notes
The note is the atomical unit of data that flows through a Graphbook workflow. A note simply holds a dictionary which encapsulates certain information about the thing that is being processed. We call them notes because they hold small units of information. For example, we can have notes for all of the world’s cars where each note stores information about a car’s model, manufacturer, price, and images of that car.
Steps
A step node defines a body of functional logic that executes when a note passes through it. Steps are fed notes as input and respond with 0 or more notes at each of its output slots. With multiple output slots, a step can be used to route or filter notes to different parts of the graph. Steps are stateful because they contain cached results stored inside of an output queue for the steps that depend on them. Each instance of a step is coupled with a special type of queue that stores the results of the step’s execution for consumption by other steps. Steps can be implemented as a function (with decorators) or as a class inheriting a base Step class. The functional way is recommended because it is more concise and less error prone. In addition to that, steps can be implemented as stateful purposely because they are normal class instances in Python that can contain members even if they are implemented the functional way. The following are examples of some of the things that a step can do:
Act as a source of notes, where it loads them from an external source or creates them from another format such as a CSV file. See
graphbook.source().Load and batch data belonging to a series of notes in parallel via our custom multiprocessing method and feed them as inputs to ML models. See
graphbook.batch().Save the results of the ML model to disk in parallel via our custom multiprocessing method.
Filter notes based on certain conditions. See
graphbook.steps.Split.Prompt users in the web UI for dynamic, manual control or other forms of human feedback during graph execution. See
graphbook.prompt().
class ImageSource(GeneratorSourceStep):
    RequiresInput = False
    Parameters = {"img_path": {"type": "string", "default": "path/to/images"}}
    Outputs = ["out"]
    Category = "Custom"

    def __init__(self, img_path):
        super().__init__()
        self.img_path = img_path

    def load(self):
        for root, dirs, files in os.walk(self.img_path):
            for file in files:
                yield Note({
                    "img": {
                        "type": "image",
                        "value": os.path.join(root, file)
                    }
                })
Resources
A resource simply holds static information as a Python variable that is meant to serve as a parameter to another resource or step node. A prime example of a resource is a model.
Tip
If a larger object such as a model is being used in multiple steps in your workflow, it is best to reuse it by putting it in a resource and feed it to the step as a parameter. This will prevent you from having multiple copies of the same model consuming memory.
from transformers import ViTForImageClassification

@resource("Custom/ImageClassifer")
@param("model_name", "string", description="The name of the model to load.")
def image_classification_resource(ctx):
    return ViTForImageClassification.from_pretrained(ctx.model_name).to('cuda')
from transformers import ViTForImageClassification

class ImageClassifier(Resource):
    Parameters = {"model_name": {"type": "string", "description": "The name of the model to load."}}
    Category = "Custom"

    def __init__(self, model_name):
        self.model = ViTForImageClassification.from_pretrained(model_name).to('cuda')

    def value(self):
        return self.model
How Nodes Are Reloaded
In Graphbook, you can create custom Python-defined nodes inside of a tracked directory (typically called custom_nodes). In between graph executions, the state of the graph is stored in memory to support caching of outputs and to only re-execute parts of the graph that have changed. When you modify the code of a node, Graphbook will automatically reload any instances of that node in memory. When an instance of a node is reloaded, it is freed from memory, losing all previous state, and reconstructed as new upon resuming execution of the graph. In addition to that, there are other times when a node will be reloaded. Below are the following scenarios when a node is marked to be reloaded which applies to both steps and resources:
When the code of the node changes
When a resource that is a parameter to the node changes
When a widget value for the node changes
It is important to note that if a file containing Python node definitions changes, then all of nodes that are defined in the same file will get reloaded even if they were not modified. This is because when you modify the code of a node, Graphbook has to reload the entire Python module, so any node definitions belonging to the same file will also get reloaded. Thus, it is best practice to separate your nodes into different files to avoid unnecessary reloads.
Workers
In order to maximize the utilization of the GPU during graph execution, we parallelize the preparation of inputs and outputs for each BatchStep (an extension of Step) across a number of workers. A BatchStep can require inputs to be prepared and outputs to be saved by workers. Each worker is a separate process that can run in parallel with others. A worker is dedicated to either preparing inputs or saving outputs, but not both. Whether it is preparing inputs or saving outputs, the worker logic is relatively the same. The Graphbook worker implementation also accounts for graph changes. In between graph executions, the workers are restarted to register any code changes, and the queues along with its elements are retained and given to the new workers.
Logic Details

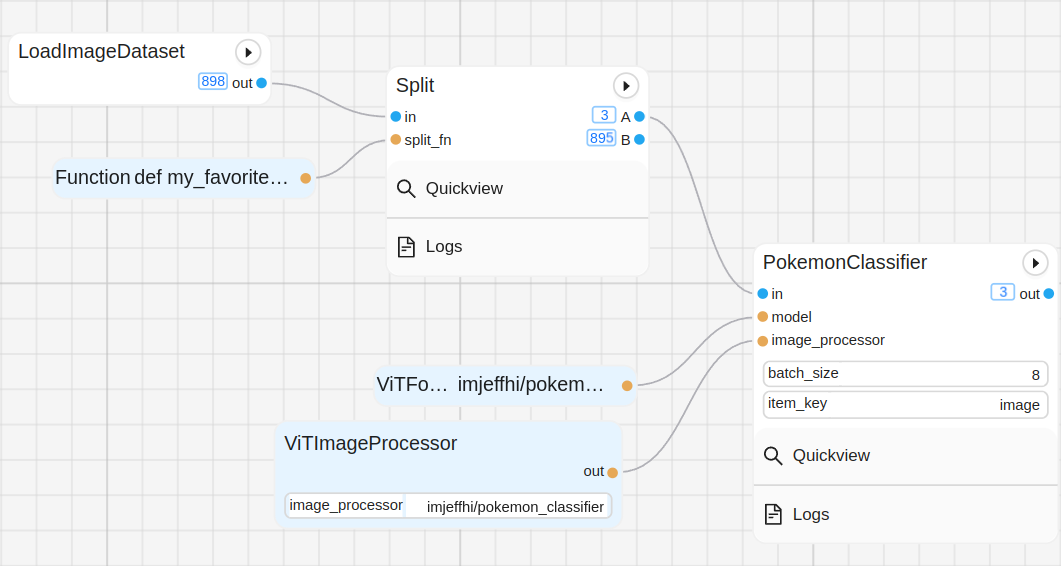
The above graph is used to explain the worker logic.

The logic behind the workers is detailed in the following steps (1-6):
A BatchStep prepares the item’s parameter inputs. The actual function, implemented by the BatchStep, is stored inside of a shared dictionary that the workers can access later.
A BatchStep enqueues the item in one of the load and dump queues, so that the workers can access them. The item is stored in its respective queue based on the
id()of the BatchStep.The workers will then dequeue the work from their work queues and execute the corresponding BatchStep’s function (
load_fn()anddump_fn()) on the item if the BatchStep still exists, but before they do that, they need to check the size of the result queue. If the result queue is full, the worker will block until space is available. The workers will rotate between queues in a round-robin fashion.After the worker has finished processing the item, it will enqueue the result in its respective result queue.
The consumer nodes will then dequeue the results from their consumer queues and process them in their correct lifecycle method. Completed load items will be delivered to
on_item_batch(results: List[any], items: List[any], notes: List[Note])where results, items, and notes are in order; i.e.results[i]corresponds to inputitems[i]and belonging to notenotes[i]. The size of the results, items, and notes lists will be equal to the batch size (or less if the batch size is not met). Completed dumped items will not be delivered to any lifecycle method. However, the BatchStep will still search for completed dumped items and keep track of which note they belong to. If all dumped items from a note are completed, then the note is considered finished and can be delivered to the next Step for processing. We do this because if a following Step depends on the saving of a particular item from that note, then that step will execute too soon.
Worker Performance Visualization
Sometimes, we do not know exactly how many workers will be needed. For this reason, Graphbook will offer an auto-scaling feature that will automatically adjust the number of workers based on the workload. For now, Graphbook offers a visualization about the performance of the workers that can indicate to the user when there are too many or too few workers, so that they can manually adjust the number of workers that they need. See example below:
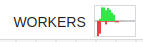
The visualization is in the form of a centered bar chart that shows the number of items that are enqueued in the work queues as red bars and the number of items that are in the result and consumer queues as green bars. Because the result queue has a max size of 32, each half of the chart is clipped at 32 to show a relative comparison between the two queue types. Refer to the following when reading this chart:
If the red bars are consistently longer than the green bars and there’s hardly any green, it indicates that there are too few workers.
If the red bars are consistently longer than the green bars but there is some green, then it indicates that the graph execution on the main process is just too slow to consume all of the results which, in turn, creates a conjestion in the workers work queues. This is because the result queues have a max size, and if they are full, the workers will be blocked until space is available while the work queues are being loaded. A max size per result queue is enforced to help prevent memory overloading issues.
If the green bars are consistently longer than the red bars, it indicates there may be enough or too many workers dependending on your system constraints.
If there are no visible bars, it indicates that the workers are not being utilized.